Maps Are Arguments About Space
Cartography is the study and practice of making maps. A cartographer chooses what to include, what to leave out, and how to show a place. Maps can record coastlines, ports, rivers, hazards, routes, political claims, and many other kinds of information. Their design depends on their purpose.
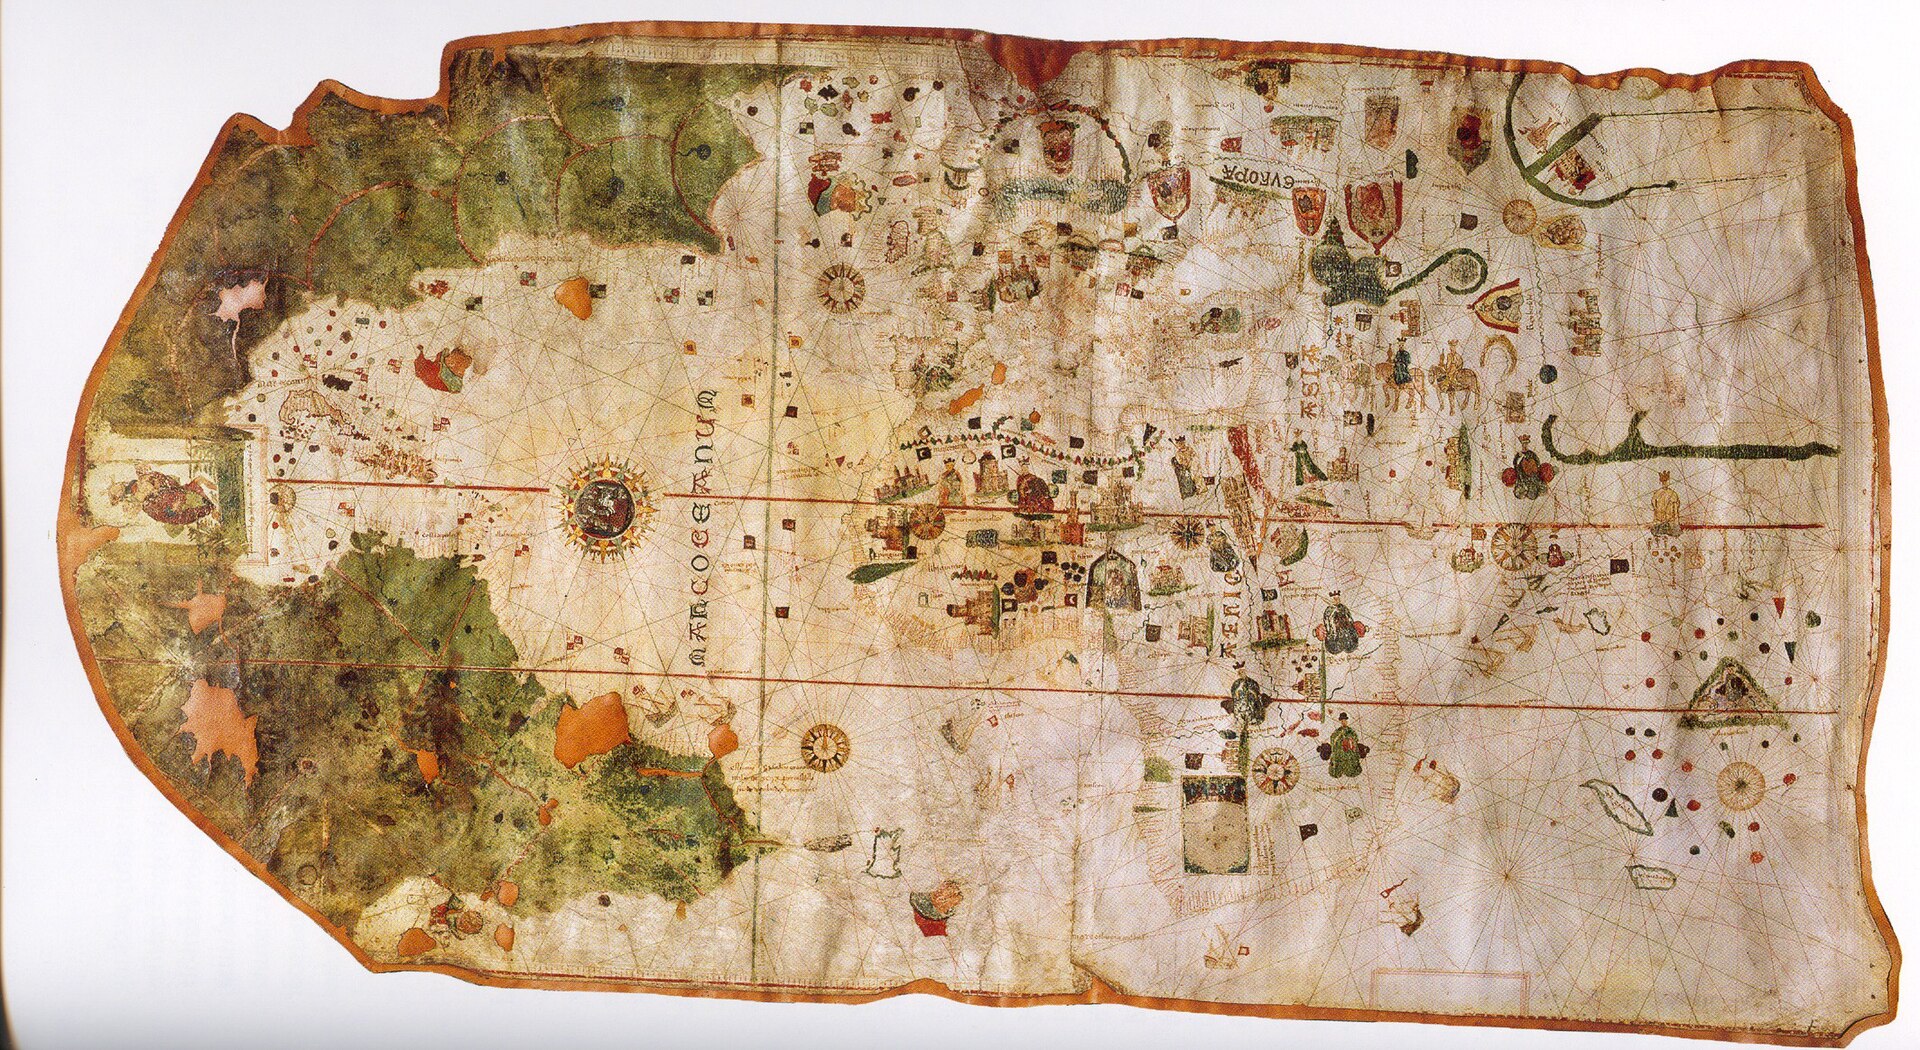
A map is not the land itself. It is a model made from evidence and choices. Early modern maps sometimes mixed careful observations with copied mistakes, incomplete reports, religious ideas, decorative images, or imagined features. Historians therefore study maps as both geographic tools and records of what their makers believed.
Mapmaking Drew on Knowledge from Many Peoples
European cartographers inherited ideas from ancient Greek and Roman geography, including the work of Ptolemy. They also learned through contact with Islamic scholars, Mediterranean pilots, African traders, Asian geographic traditions, and generations of sailors. Translation, trade, travel, and conquest moved geographic knowledge across cultural boundaries.
Indigenous peoples also guided newcomers through lands and waterways that Europeans did not know. European mapmakers often used Indigenous place names, routes, and geographic knowledge, although finished maps did not always credit the people who supplied that information. A map labeled as a European creation could therefore contain knowledge gathered from many communities.
Charts Helped Sailors Along Coasts
Mariners used nautical charts to identify coastlines, harbors, islands, and sailing directions. Many charts included lines that helped pilots follow compass directions between places. Sailors combined these charts with written directions, depth measurements, landmarks, the sky, and their own experience.
Charts were especially useful near known coasts. They could not reveal an exact position everywhere, and a copied error could mislead later travelers. Voyages also produced new observations. When ships returned, pilots and cartographers could revise coastlines, add ports, or record routes. Exploration and mapmaking shaped one another.
A Round Earth Creates a Flat-Map Problem
Earth is curved, but a paper map or screen is flat. A map projection is a method for transferring locations from the curved globe to a flat surface. This process always changes something. A world map cannot keep area, shape, distance, and direction perfectly accurate at the same time.
Cartographers choose a projection based on the map’s job. One projection may preserve relative area but stretch shapes. Another may show directions well while changing the apparent size of land. Distortion does not automatically make a map dishonest or useless. The important questions are: What does this projection preserve, what does it distort, and is it suitable for the task?
Mercator Designed a Navigation Tool
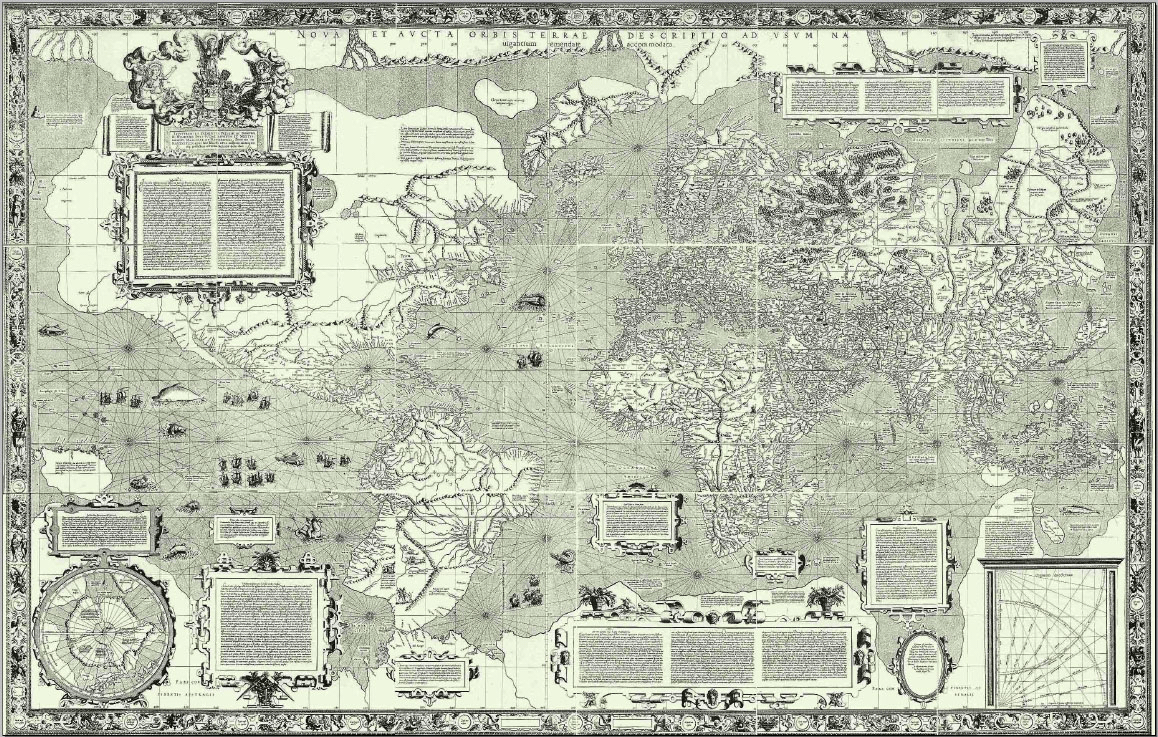
In 1569, the Flemish cartographer Gerardus Mercator published a world map using the projection now named for him. Its lines of latitude and longitude cross at right angles. It preserves local angles and allows a navigator to draw a constant compass course as a straight line. These features made it valuable for ocean navigation.
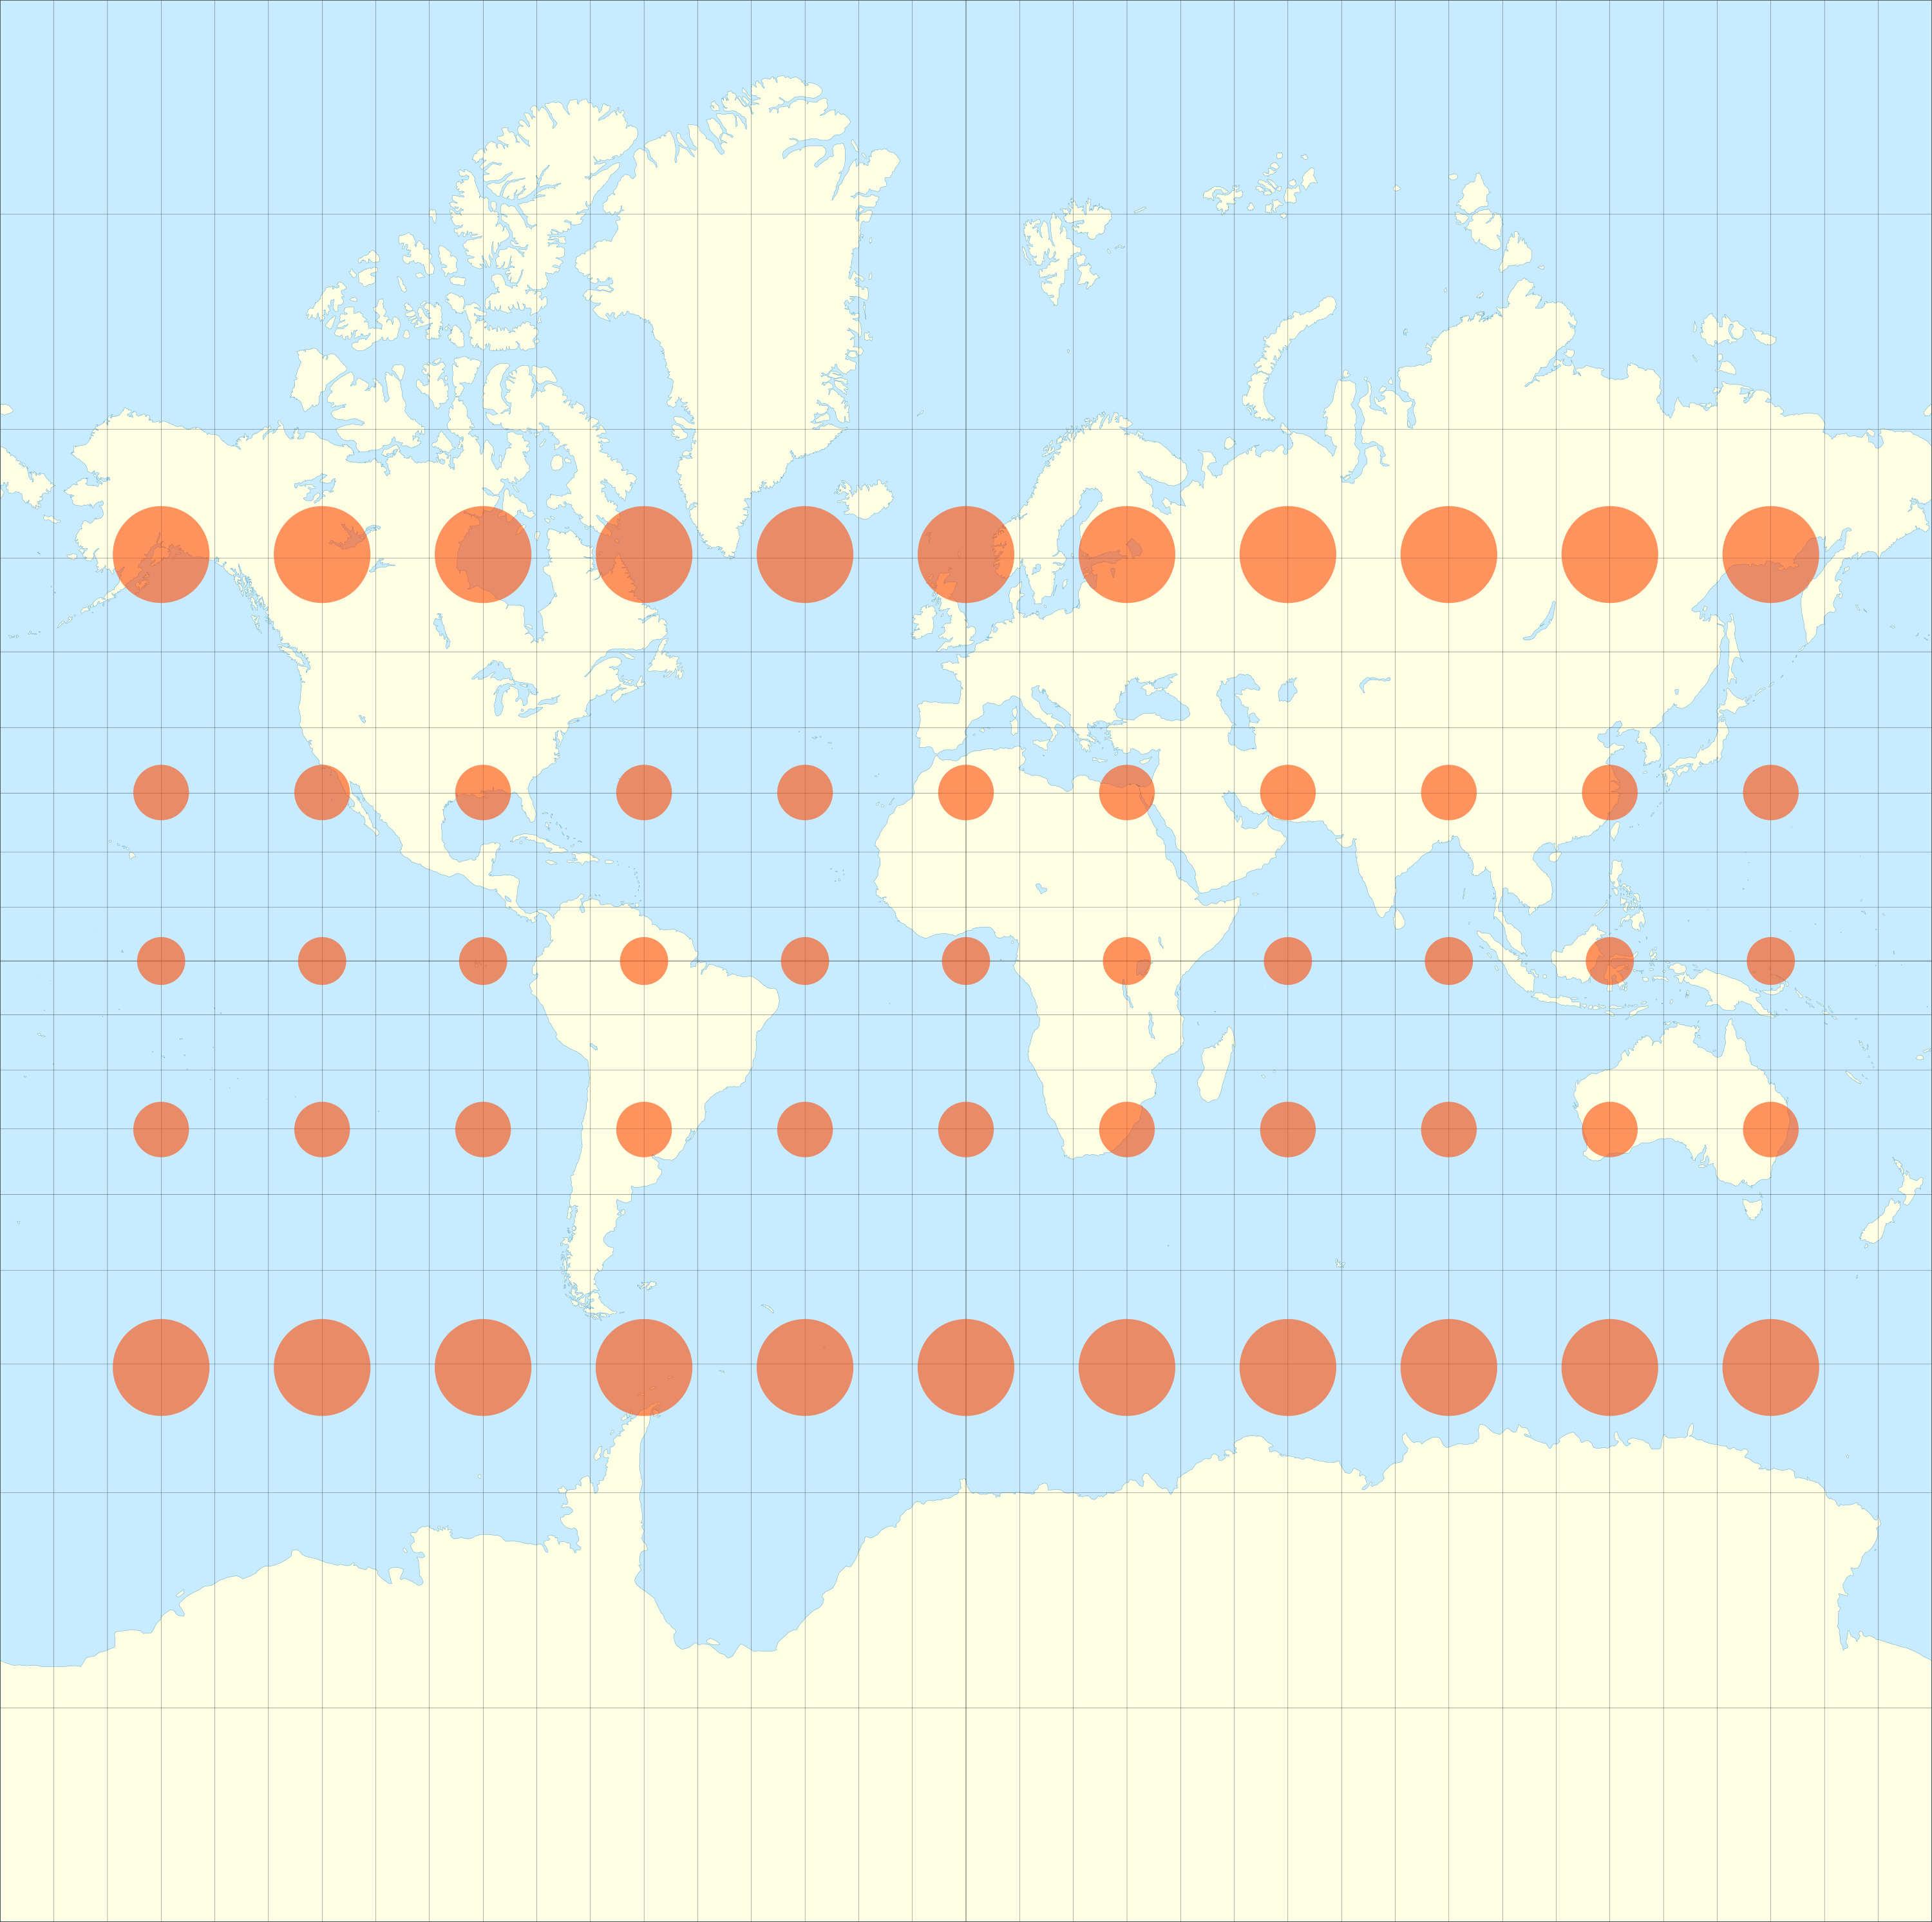
The Mercator projection was designed for a particular purpose, not as a perfectly sized picture of the world. Its scale increases farther from the equator. Land near the poles appears much larger than it really is. Greenland, for example, can look close in size to South America even though South America is more than eight times larger.
Reading Maps Critically
The Mercator projection still appears in some navigation systems and online maps because it handles direction and zooming well. Other world maps use projections that better compare the relative sizes of continents. Each choice creates different strengths and weaknesses.
Maps also carry human choices about labels, borders, centers, and viewpoints. During European expansion, maps could support navigation and learning, but they could also display claims to lands already inhabited and governed by other peoples. A careful reader asks who made a map, when it was made, what evidence it used, what purpose it served, and whose knowledge or authority may be missing.
Check Your Understanding
Choose the best answer. If you miss one, use the feedback and try again.
Why does every flat world map contain some distortion?
Why was the Mercator projection useful for ocean navigation?
Which question helps a historian read a map critically?